Colour By Numbers
Networking a Colour History of the Refrigerator
Color in appliances probably is a thing of mixed emotions to everybody”
.—Good Housekeeping Institute, 1956, from “The Colour Revolution” by R.L. Blaszczyk.
In 1951, Ernest Dichter’s Institute for Motivational Research prepared a report for the Ralph H. Jones Advertising Agency. Jones and his colleagues were looking for ways to shake up their marketing strategy for refrigerators, a product that was not too different from brand to brand and wasn’t exactly glamourous. Fresh off the end of the Second World War, women were let go from factory work, and returned to the heart of the domestic sphere, the kitchen. The 1950s housewife was vibrant and optimistic, and what she wanted, the report stated, was to express her creativity and individuality. What she didn’t want was her mother’s dreary kitchen. The answer was to pitch something else: a kitchen in full, glorious colour, far removed from the sterile white kitchens of wartime, and complete with appliances to match[1].
Thank goodness for men in suits telling us what women want is a wall to wall pink kitchen…
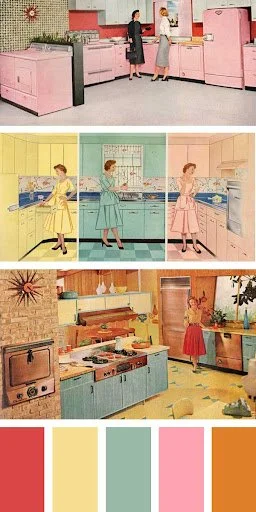
1950’s kitchens. I think the bottom design would fly today. Who wouldn’t want a wall oven?? Photo: Glamorously Vintage, used with permission
Around the same time, the influential House & Garden Magazine unveiled its “House & Garden Colour Program”, a series of colours, endorsed by the tastemakers at the magazine, which could be applied to “a broad swath of goods, coordinated across a range of industries”[2].
1950s was the decade that brought us the concept of colour matching, and there were three main industries driving it: automobiles, Bell 500 series telephones, and refrigerators[3].

House & Garden Colour Program Swatch Card, House & Garden Magazine, Summer 1978[4].
The 50s pastels and 70s earth tones were not accidental. The people working in what was the new field of colour engineering in the early part of the century, and the companies behind the products we buy are very much the reason why the decades “look” the way they do. Colour engineers took their cues from all kinds of places, including famous gardens, ballets, cultural events, what women in the streets were wearing, and the First Lady of the United States. Refrigerators and their shifting hues are a document of the tastes of colour “influencers”, and a reflection of the consumer culture of decades past[5].
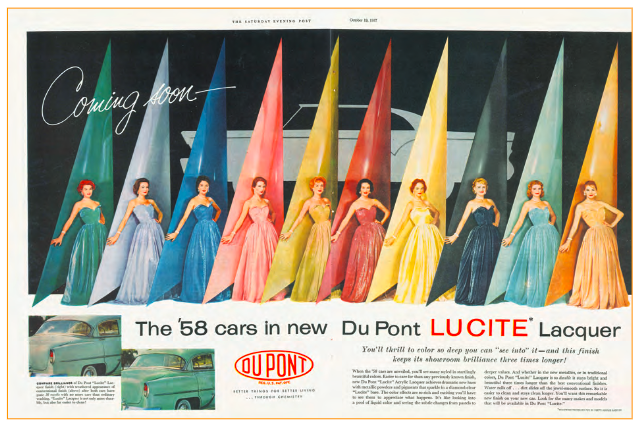
Advertisement for Lucite Lacquer Saturday Evening Post, Oct 19, 1957.
For this next chapter into my deep dive into the history of the refrigerator, I was first given the medium I would be working with – a network visualization using Onodo (now, sadly, no longer with us). I realized very quickly that it’s much easier to start with some data you want to visualize then choose a type of visualization that will show what you want it to, rather than start with the medium, and find the data that fits. Since a network visualization and colour both engage our sense of sight, I decided to use the colour data from across the decades of refrigeration, and create a network with products from the three industries that drove colour innovation. I pulled the data, in this case, colour names and when the products in the colour were produced, from various primary sources, included a very cool stack of trade manuals from the early part of the century. My final network shows the decades in colour, and products by colour, and the relationships between those products in those colours, by decade.
If the above description gives you a headache, I feel you. I really enjoy the work of data artist Jer Thorpe, and his book Living in Data, (and if you haven’t already, I encourage you to check him out) but whenever he describes specific visualizations in words, I can’t “see” them and have to look them up online to understand what he’s writing about. Visualizations are another way to look at data, in a way that is very different from reading. In the digital humanities, we talk a lot about making data more accessible. Some people are readers and others are visualizers. Presenting information in multiple formats (maybe?) increases the likelihood that it will be understood by more people.

A snapshot of the vis: The 1950s were by far the most colourful decade, and we became pretty boring from the 80s on, but this decade is shaping up to embrace colour again.
As Thorpe says, “the choice of medium for a data representation is embedded with its own opportunities and its own unavoidable constraints”, and this project is no different. I did could not include colour data for each product, in each decade. I only connected a product to a colour in the decades where all three products – phones, cars, and refrigerators – were made in that colour, in order to get a better sense of the ways colour was used to coordinate the material world of the consumer. To expand this visualization and get a more fulsome picture of colour through the decades, I would need to add more things, like paint colours, clothing, or other household goods like dishwashers and stoves. With the sheer amount of stuff we buy and the colours we buy them in, this is a visualization that has the potential to be massive. I could also track down sales figures, but this is less of a statistical analysis and more of an anecdotal one.
Thorpe also points out the tendency with visualizations to fall in love with your data. I admit, out of the three mediums I’ve been playing with, including maps and timelines, I enjoyed the network the most and especially playing around with the nodes so that the relationships unfold and change, and seeing each decade in glorious colour. I hope you will too.
Notes
[1] R. L. Blaszczyk. The Color Revolution. Cambridge: MIT Press, 2012: 256.
[2] Blaszczyk, 237
[3] Blaszcyk, Chapter 10.
[4] Nadine Bertin. “The House & Garden Color Program.” Color research and application 3, no. 2 (1978): 73.
[5] Blaszczyk, Chapter 11.
Sources
Bertin, Nadine. “The House & Garden Color Program.” Color research and application 3, no. 2 (1978): 71–78.
Blaszczyk, R. L. The Color Revolution. Cambridge: MIT Press, 2012.
J, Tara. 2021. “Kitchen Colors – Colors Through The Years 1950, 1960 And 1970.” Glamorously Vintage. 2017. http://glamorouslyvintage.com/kitchen-colors-colors-through-the-years-1950-1960-and-1970/.
Ketcham, Howard. Color Planning for Business and Industry. New York: Harper & Brothers, 1958.
Sadez Friedmann, Rosemary. “Appliance Colors Tell Kitchen History.” Star Tribune (Minneapolis, MN), December 15, 2012. https://www.startribune.com/appliance-colors-tell-kitchen-history/183530031/.